Is a Rare Diamond Top Forming on the S&P 500?
Diamond reversal patterns are one of those chart formations everyone has heard of, but very few have actually seen — let alone traded correctly. They’re rare, they’re dramatic, and when they appear at the right place in the trend, they can mark a genuine shift in market control.
But here’s the thing: most people misidentify them. They confuse them with head and shoulders patterns, broadening formations, or just general market noise. A diamond is none of those things. It’s a very specific sequence of price behaviour that reflects a market losing control, finding balance, and then breaking into a new trend.
What a Diamond Pattern Actually Is
A diamond is a reversal formation that appears at the end of a mature trend. You can have a Diamond Top which is a bearish reversal and a Diamond Bottom which is a bullish reversal
The defining feature is the shape: price first expands (like a megaphone) and then contracts (like a symmetrical triangle). When you connect the highs and lows, you get a diamond shaped structure.
The Behaviour Behind the Pattern
A diamond is the market’s way of saying: “The old trend is losing authority, and nobody is quite sure who’s in charge.”
Here’s the behavioral sequence:
- Volatility expands The trend becomes unstable. Price makes a higher high, then a lower low. Control slips.
- Volatility contracts The swings tighten. Buyers and sellers reach a temporary equilibrium.
- Pressure builds The market compresses into the apex of the diamond.
- Breakout confirms the new trend
- Diamond top → breakdown
- Diamond bottom → breakout
It’s the transition from chaos → balance → decision.
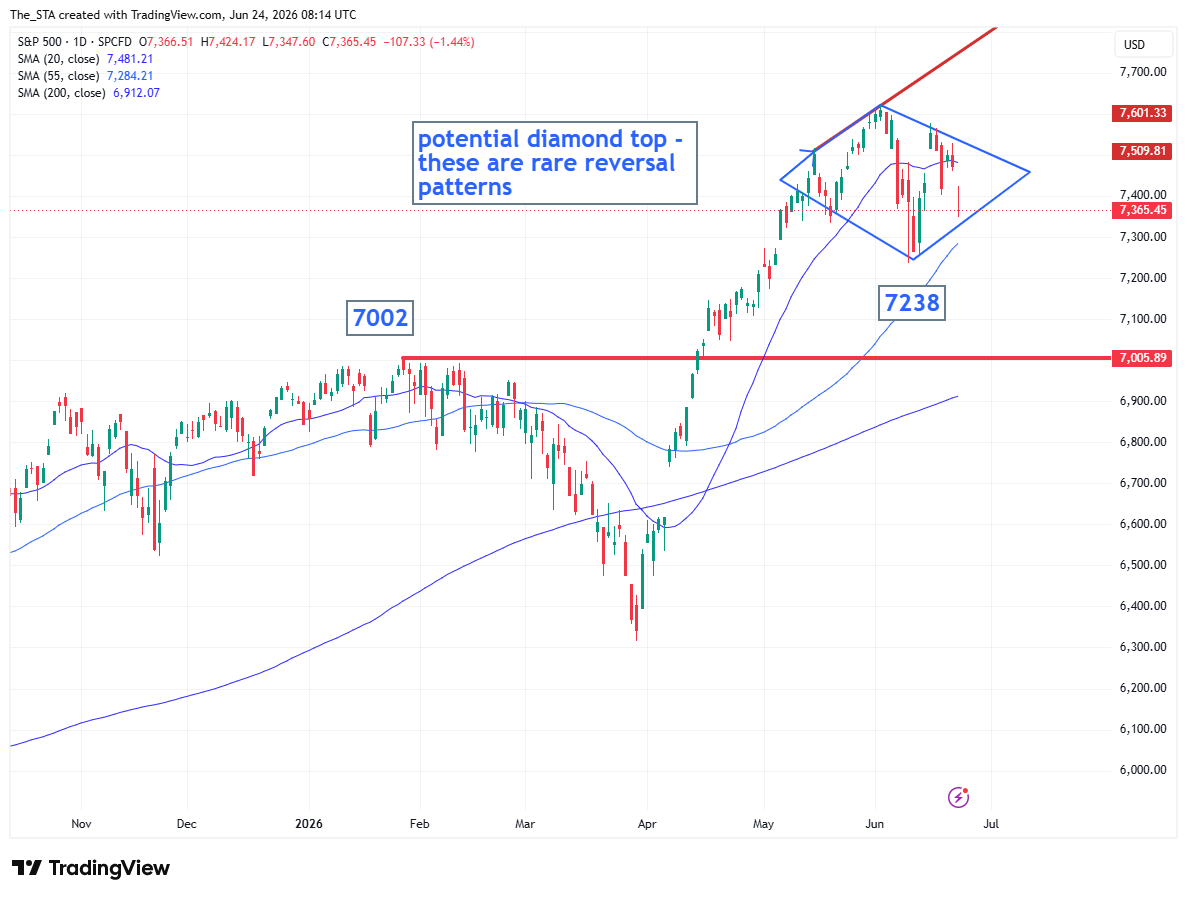
There may be a potential diamond top on the S+P!
Diamond tops tend to form during distribution — when buyers are exhausted and the market is topping out. They are typically large, slow forming, and significant.
How to Identify a Diamond (Without Fooling Yourself)
Look for:
- A mature trend (this is non negotiable)
- A broadening formation on the left side
- A contracting formation on the right side
- Symmetry — not perfect, but recognisable
- A decisive breakout after the pattern completes
If you’re squinting to see it, it’s not a diamond.
How Traders Use It
The classic approach is simple:
- Wait
for the breakout — never anticipate
- Measure the widest part of the diamond
- Project that distance from the breakout point
- Place stops outside the opposite boundary
Because the pattern is rare, traders often get excited and jump in early. That’s how diamonds turn into expensive hallucinations.
Why Diamonds Matter
Most chart patterns are just variations of supply and demand. Diamonds are different. They capture a transition of power — a genuine shift in market behaviour.
They’re not common, but when they appear at the right moment, they can mark the end of a major trend and the beginning of a new one.
And that’s why they’re worth understanding properly.
Disclaimer:
This commentary is for educational and informational purposes only and reflects general market behaviour, not investment advice. It does not consider your personal financial situation. Markets can behave unpredictably, and patterns can fail. Always do your own research or consult a qualified financial professional.
By
Karen Jones FSTA Professional Technical Analyst and Content Creator for the STA
Karen Jones LinkedIn profile linkedin.com/in/karen-jones-fsta-a2907b9
#TechnicalAnalysis #MarketStructure #BehaviouralFinance